Applied Statistical Computing
Learning objectives
- Develop the mindset of working backwards from given specifications
- Feel comfortable manipulating non-table-like data
- Understand the strengths of programming over Excel/Calculators
- Be able to simulate classic statistics
Expectations
- On Canvas, read it, it can be updated
- Example in-class survey on Canvas
- Homework 1 will be out on Ed
How to be successful in this class?
- Always have an expectation, then validate it
- Run the examples and try to break it
evens_example <- c(2, 4, 6) # Try things out! more_evens <- c(2, 4, 6, 8) evens_no_comma <- c(2 4 6) - Ask questions online with clear attempts at the problem
- Bad example
I tried to derive the sum of the shortest distance
function but it seems impossible to do it. (What did
I do wrong?)
- Bad example
- Google can be your best friend
Why computing? - Efficiency
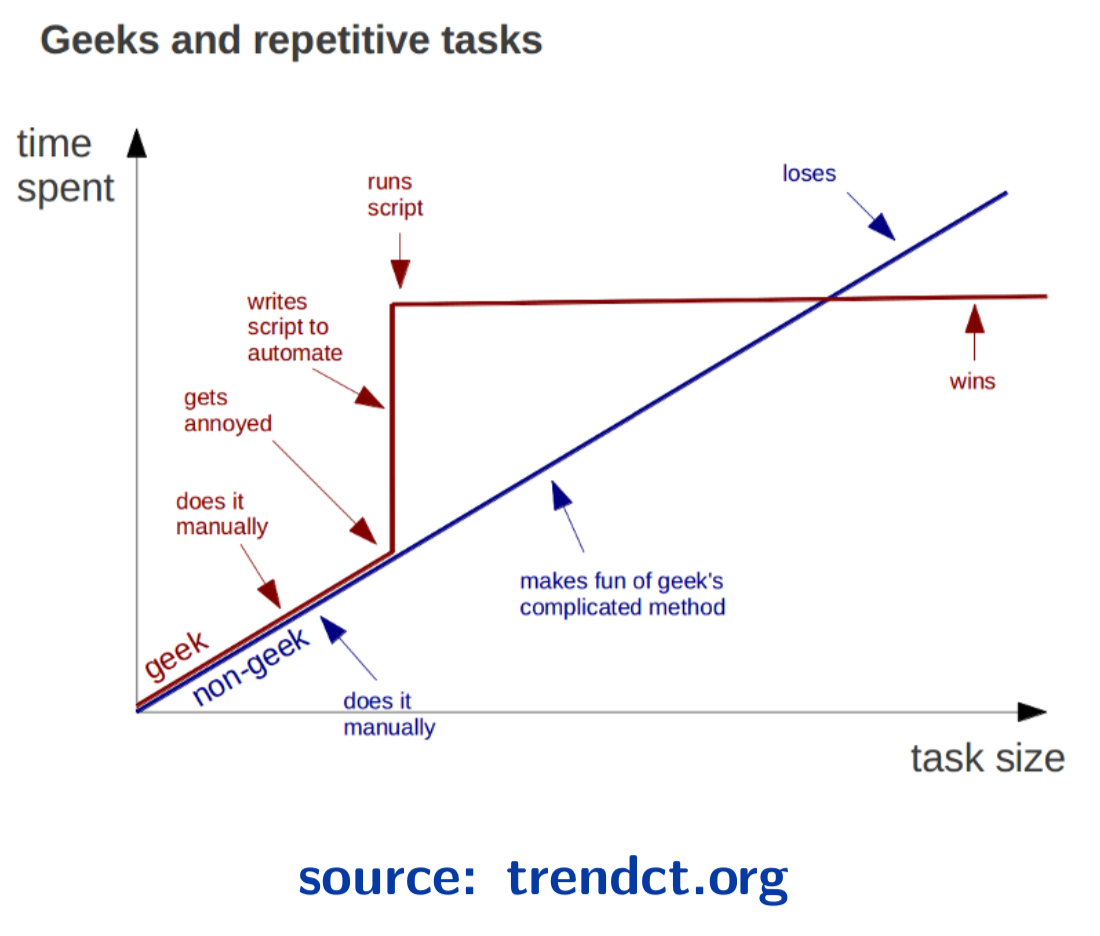
Thanks to Prof Thibault Vatter for this slide.
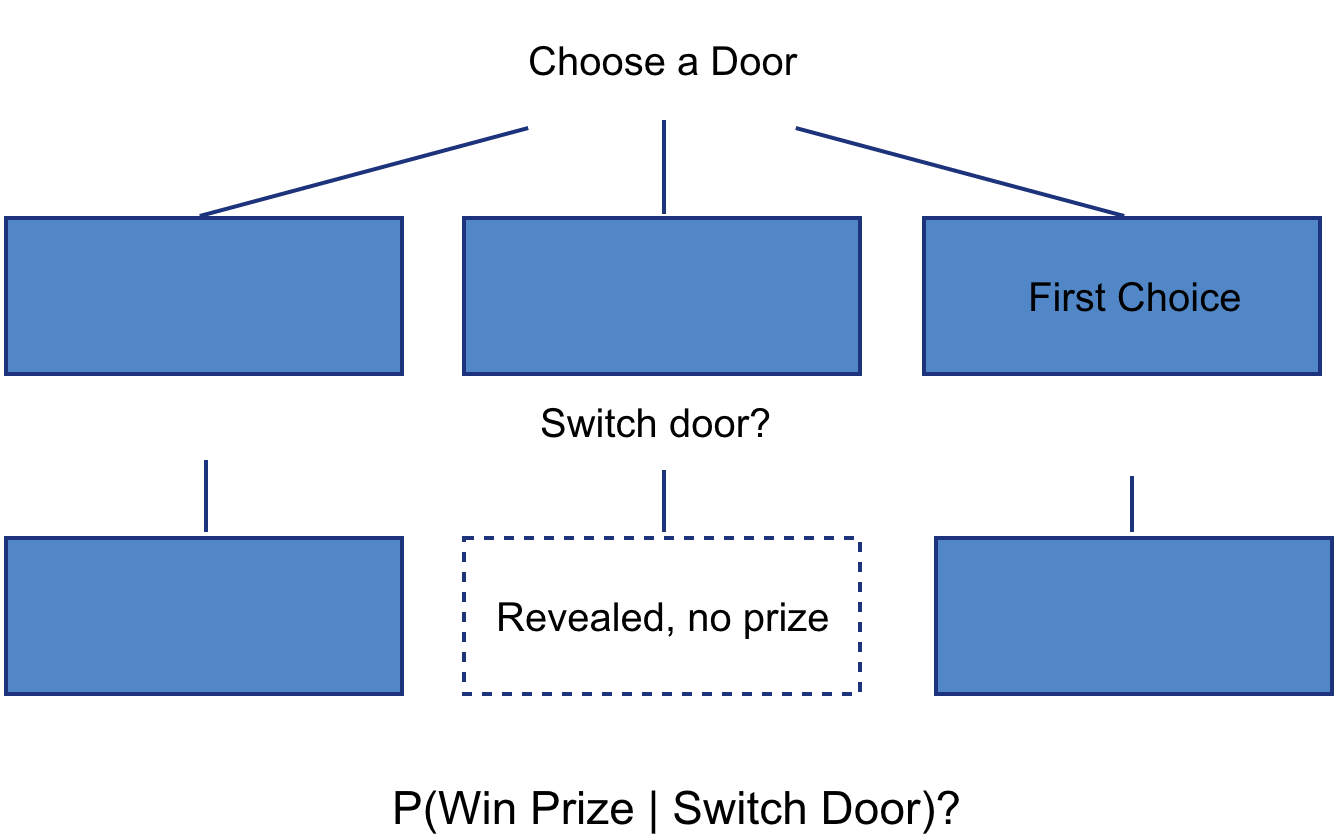
Why statistical computing? - Simulations can help validate theoretical results
- Monte Hall problem
- Fitting models when the assumptions are violated
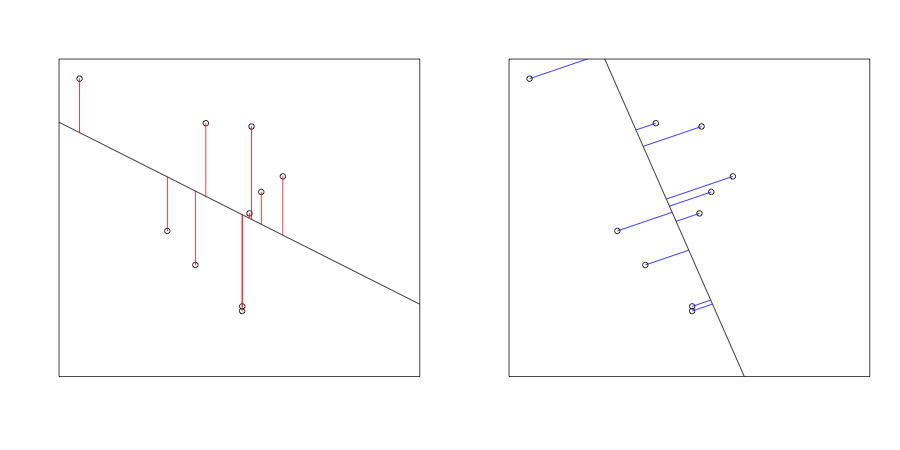
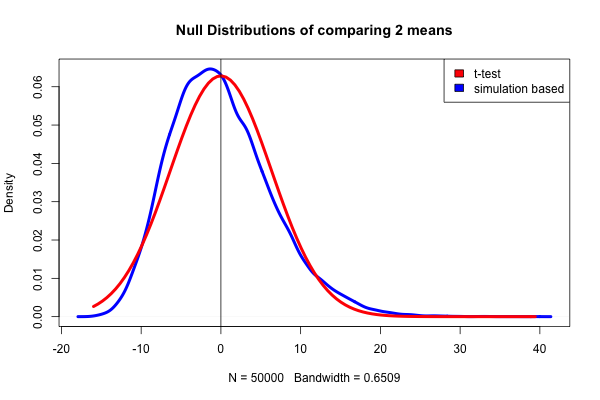
Why statistical computing? - Simulations allow more diverse approaches
- Permutation test instead of 2 sample t-test: no longer as dependent on Normal distribution
Why statistical computing? - Programming can handle big data
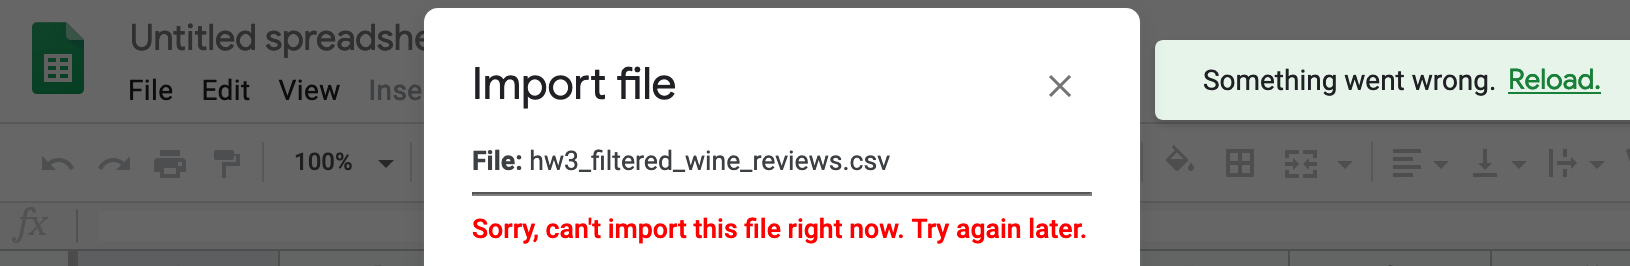
- Wine Reviews from Kaggle
Why statistical computing? - Lots of data are in non-tabular formats
JSON data from Indeed.com
{"request_params":
    {"jt": "fulltime",
     "q": "data",
     "l": "New York State",
     "start": 10},
 "job_descriptions":
    ["Description: This position ...",
     "At Noom, we use scientifically proven...",
     ...,
     "The NYC Department of Environmental Protection (DEP)..."]
 }
Why statistical computing? - Readable code
Normalizing data
- Using code
std_unit_data <- (data - mean(data)) / sd(data) max_range <- max(data) - min(data) frac_data <- (data - min(data)) / max_range -
Using spreadsheets
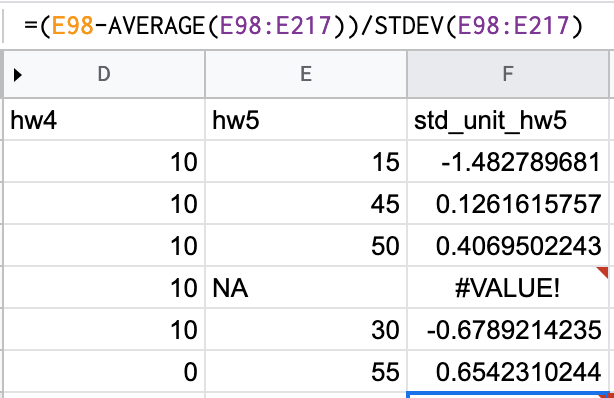
Excel does not guarantee each cell has the same code, allowing people to plant bugs
Why statistical computing? - Reproducible research
- Using code to clean data - original data is not perturbed!
large_dev <- 3 * sd(data) outliers <- abs(data - mean(data)) > large_dev clean_data <- data[!outlier] - Using spreadsheets to clean data - how would you do it?
Why R? It’s popular
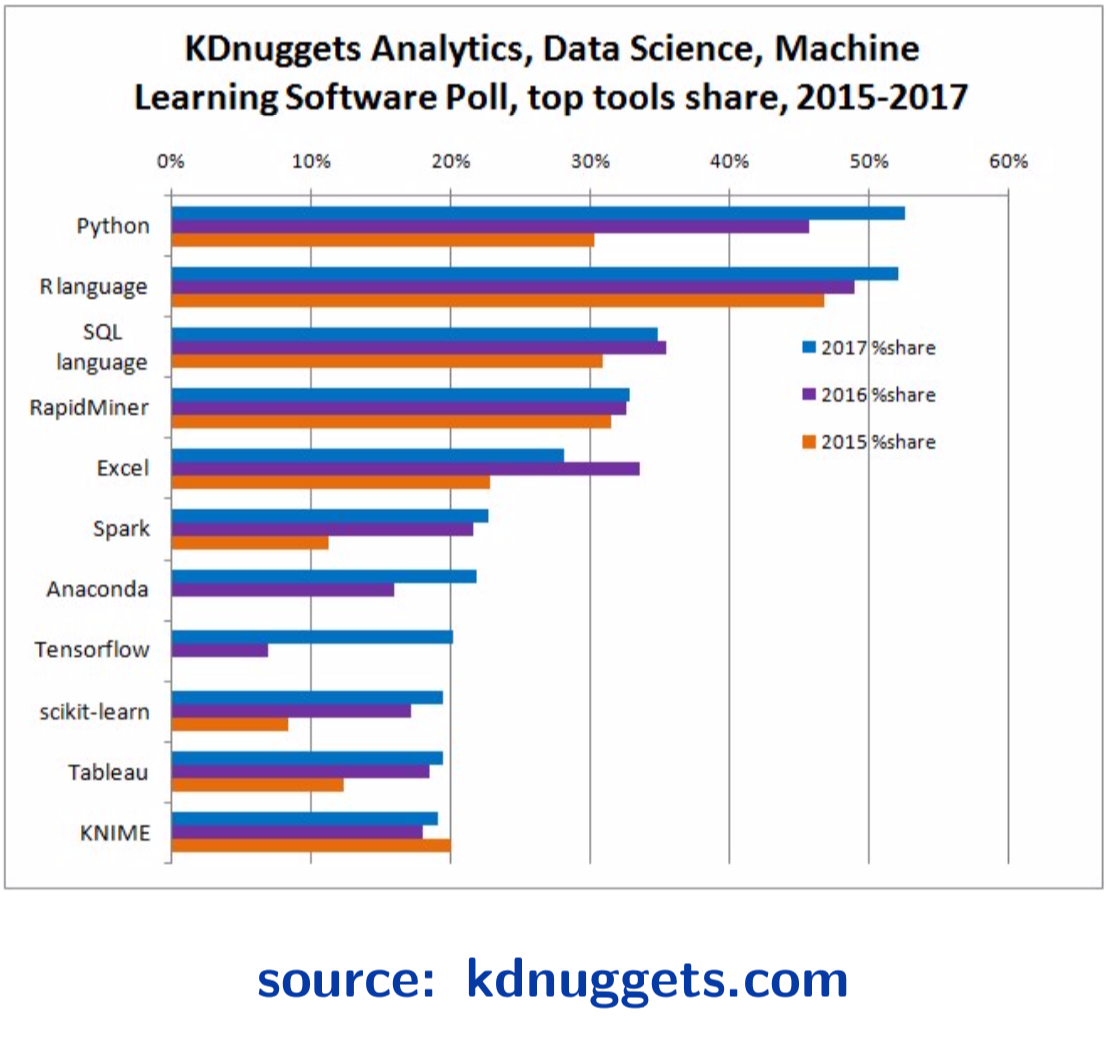
Thanks to Prof Thibault Vatter for this slide.