Quickly summarizing data
Besides visualizing the data, we often want to summarize the data across different dimensions as well.
To demonstrate this, we will re-introduce the classic grain harvest data by Fisher. This dataset contains the information from a single year of harvest under different fertilizer treatments: amount, timing, and type of fertilizer.
What’s unique about this experiment is that Fisher also grouped the different treatment plots into blocks on the field such that the different fertility levels from different parts of the field would be controlled between treatments.
Exploring the dataset
grain <- read.csv("fisher_1927_grian.csv")

dim(grain)

grain
What to notice?
- For each block, there are 4 control plots and 8 treatment plots, i.e. 12 plots per block
- The different treatment names are:
top_dressing: fertilizer amount, ranging from 0, 1, to 2.fertilizer_type: main fertilizer chemical, sulphate or muriatetiming: the timing of applying the fertilizer, early or late
- The control plots have 0 fertilizer which is why their other treatments are blank.
- There are 8 different blocks.
Calculate summary statistics along different dimensions using apply()
To compare the different blocks, we could calculate the total yields for each block. First try doing this with a for-loop:
block_columns <- paste0('block', 1:8)
block_totals <- rep(NA, length(block_columns))
for(block in seq_along(block_columns)){
    block_totals[i] <- sum(grain[, block])
}
names(block_totals) <- block_columns
block_totals
We used subsetting by character values to grab the different columns from the data frame then changed the name of the vector to align with the different columns.
Turns out we can do this in one line using apply()
block_totals <- apply(grain[, block_columns], 2, sum)
block_totals
What to notice?
- The placeholder for the data is automatically generated in the background, this was somehow chosen to be a vector.
apply()knew to apply the function,sum, through all the columns- The names for the columns were passed down to the output
Elements of apply()
If you look at the documentation for apply(), you’ll see something like apply(X, MARGIN, FUNCTION, ...)
- The data part
X: the main data that is often “rectangular” like a matrix or data frame.MARGIN: the dimension(s) to preserve (as opposed to being aggregated by the function) or the dimension you are passing into the function as a “chunk” e.g. 1 corresponds to rows and 2 corresponds to columns
- The function part
FUNCTION: the function, e.g.mean(),sd()or a custom-defined function that will take in the different “chunks” of data as the first argument....: not literally typing in...intoapply()but this represents you can pass in arbitrary number of arguments separated by,that will be passed toFUNCTIONby name or order, e.g.sizeandreplaceinsample(). Since the chunk of data is the first argument, these arguments will be the second and on.
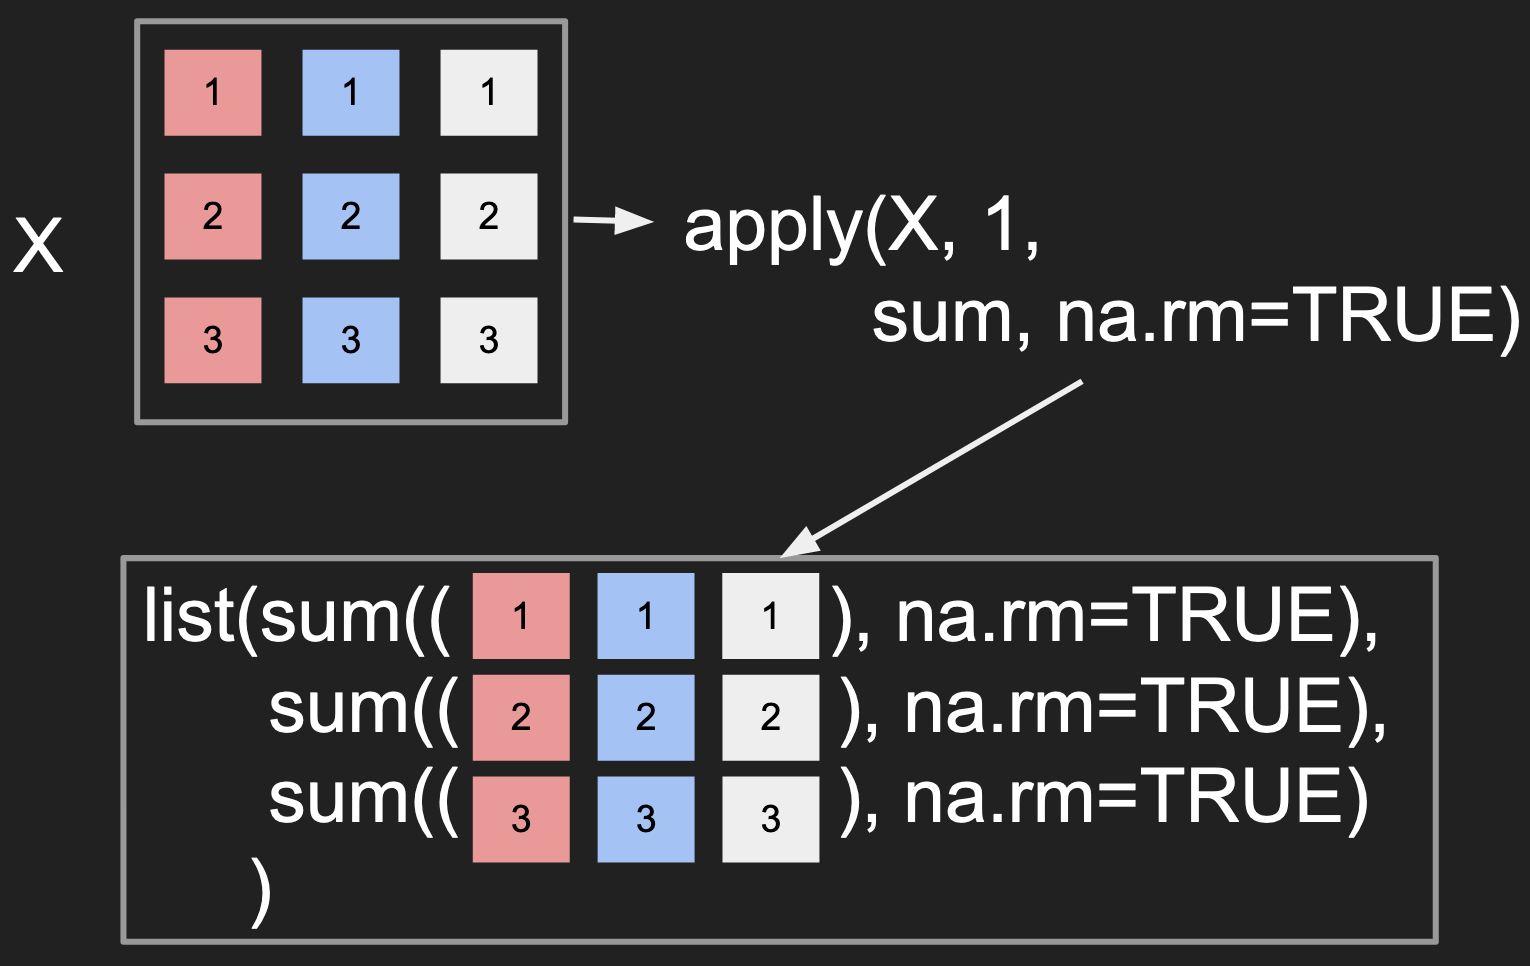
Below are 2 different visualizations for how apply() works:
Applying a function across the data in the rows
Applying a function across the data in the columns
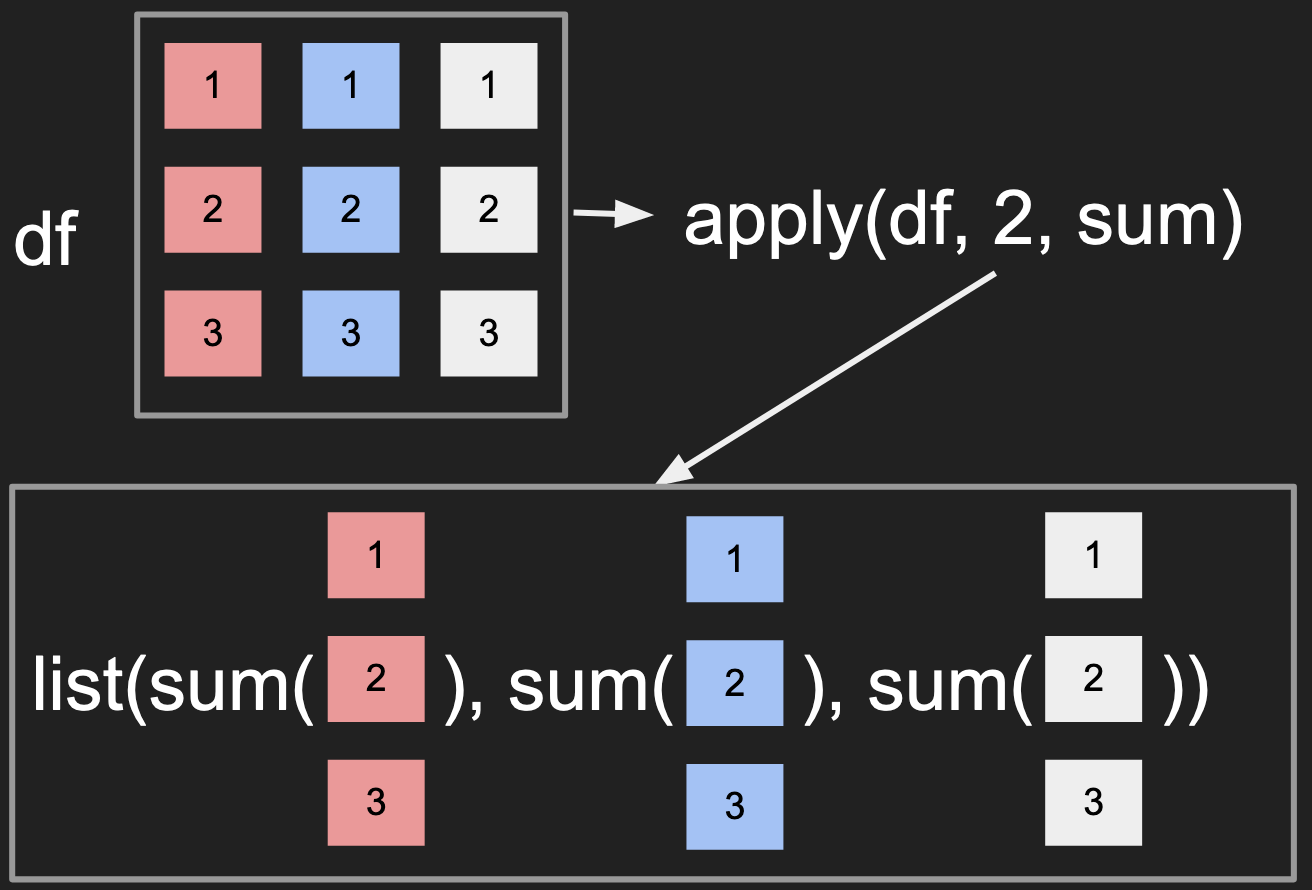
- Notice how the
MARGINcontrols whether the columns or rows are passed to the function. - The visualization suggests that the output should be a
list, there is some extra logic that actually simplifies the output to a simple vector here.
Apply a function on records that satisfy a condition
For the Fisher dataset, Fisher also wants to calculate the total yield from all the plots that had “sulphate” vs “muriate”. This way we can calculate the difference to then derive the average treatment effect.
To accomplish this calculation, we can first calculate the row totals then perform a for-loop
block_columns <- paste0('block', 1:8)
row_totals <- apply(grain[, block_columns], 1, sum)
fert_types <- unique(grain$fertilizer_type)
trt_totals <- rep(0, length(fert_types))
for(i in seq_along(fert_types)){
    condition <- grain$fertilizer_type == fert_types[i]
    trt_totals[i] <- sum(row_totals[condition])
}
names(trt_totals) <- fert_types
Notice that the “non-treatment” case also is captured.
Turns out this also can be done with one line.
block_columns <- paste0('block', 1:8)
row_totals <- apply(grain[, block_columns], 1, sum)
trt_totals <- tapply(row_totals, grain$fertilizer_type, sum)
trt_totals
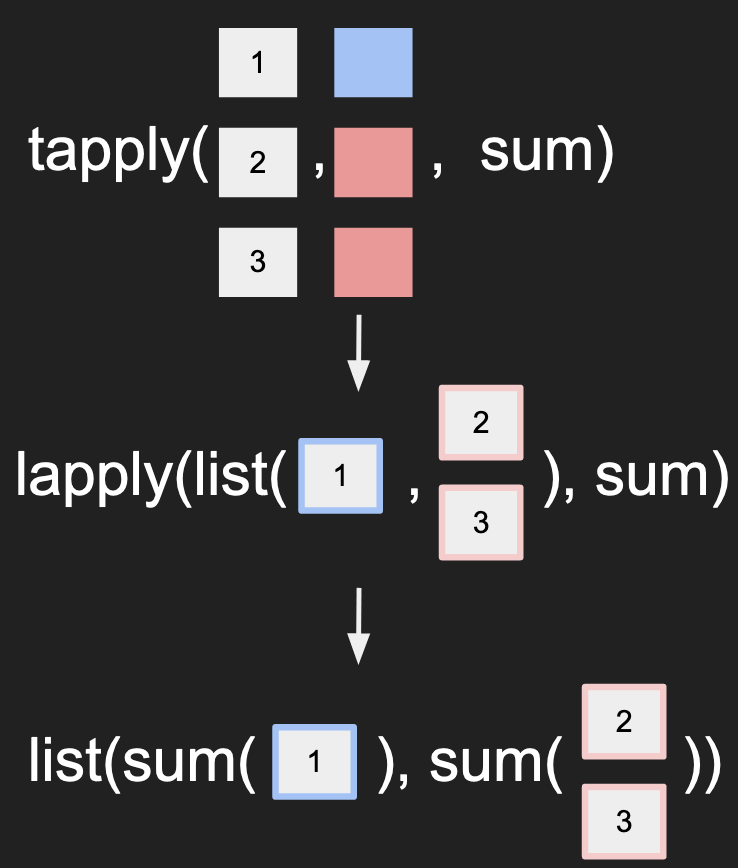
Similar to apply(), tapply() is a different function that applies the function to
a particular chunk of the data. It also passes the names from the conditions to
the final output.
You can also get the totals by cross multiple factors
block_columns <- paste0('block', 1:8)
row_totals <- apply(grain[, block_columns], 1, sum)
trt_totals <- tapply(row_totals, list(grain$fertilizer_type,
                                      grain$timing), sum)
trt_totals
Elements of tapply()
If you look at the documentation for tapply(), you’ll see something like tapply(X, INDEX, FUNCTION, ...)
- The data part
X: the data is a vector of length nINDEX: this is a factor vector OR a list of factors. Each factor must be of length n (same asX) so the subsetting (as done in the for-loop) is possible.
- The function part
FUNCTION: the function, e.g.mean(),sd()or a custom-defined function that will take in the different “chunks” of data as the first argument....: not literally typing in...intoapply()but this represents you can pass in arbitrary number of arguments separated by,that will be passed toFUNCTIONby name or order, e.g.sizeandreplaceinsample(). Since the chunk of data is the first argument, these arguments will be the second and on.
Here’s a way to visualize how tapply() works:
Working on multiple columns using aggregate()
Notice how tapply() required us to calcuate the row totals first but it’s
possible that we wanted to perform the calculation on each block separately.
To accomplish this, we can use aggregate()
block_columns <- paste0('block', 1:8)
block_trt_totals <- aggregate(grain[, block_columns], grain['fertilizer_type'], sum)
block_trt_totals
- You should replace
grain['fertilizer_type']withgrain$fertilizer_typeand see what error gets returned. Given data frames are a special case of lists, does that explain the behavior above? - Notice instead of the unique values becoming the names of the output, the values become a distinct column instead.
aggregate() is very similar to tapply() except that the data argument can be
a matrix or data frame with multiple columns instead of just a single vector.
You can also pass multiple factors as well, please notice how the output is different from tapply()
block_columns <- paste0('block', 1:8)
block_trt_totals <- aggregate(grain[, block_columns],
                              grain[c('fertilizer_type', 'timing')],
                              sum)
block_trt_totals
Review
- Overall we introduced
apply(),tapply(), andaggregate()as ways to apply functions onto different “chunks” of data that has a rectangular format. - Relative to for-loops, these functions work more in a parallel fashion rather than a sequential manner like a for-loop. Understanding these functions will help you understand how big data methods (map/reduce) behave in the future.