Homework 4: Diagnostics
Validating residuals
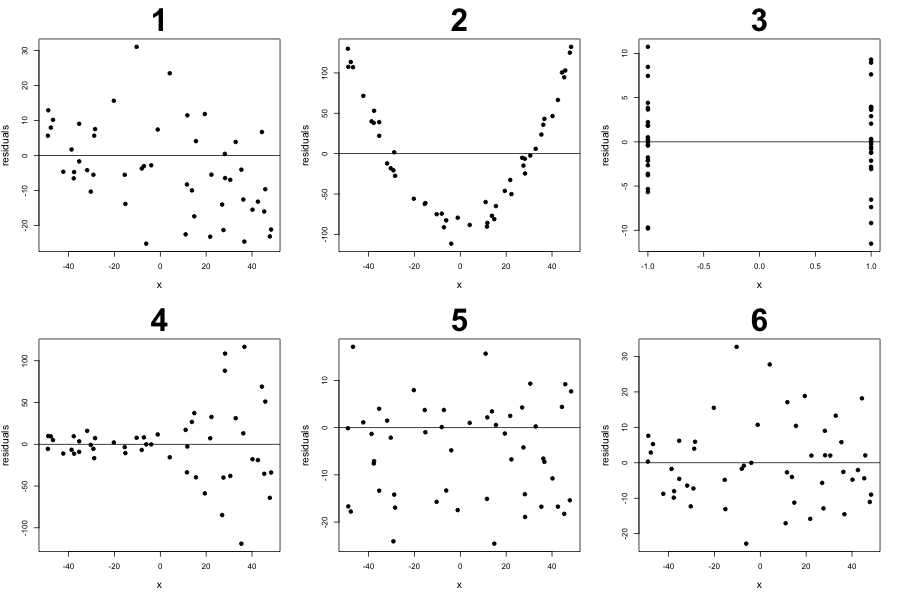
In the following are several residuals plots after fitting a line to the data (may not be the regression line). Recall that the regression line minimizes the total squared error . Please use the following residuals plotted against their feature values to answer the following questions.

Q1
Which graphs are likely not a result from fitting a SLR?
Q2
True/False, the graphs you chose in Q1 can achieve a better (smaller) sum of squared error if they fitted an SLR instead?
Q3
Which graphs will have an unbiased estimates for the slope and intercept parameters for SLR?
Q4
Which graphs satisfy the assumption that the variance of the noise is a constant? i.e. \(Var(epsilon_i|X) = \sigma^2\)?
Q5
Which graphs satisfy the assumption that \(Var(Y_i - \hat{Y}_i|X) = \alpha\)?
Q6
Assuming we fitted an SLR to each of these datasets, then used the formula in class to calculate the variance of the parameters, for which graphs should you doubt the values of the variance?
Simulations
For the following problems, please generate exactly 100 Normal random variables called \(X \sim N(\mu_x=50, \sigma^2_x=10^2)\). With an \(\beta_0 = -100\), \(\beta_1= 0.3\), and 100 additional Normal random errors, \(\epsilon_i \sim N(0, \sigma^2_{\epsilon} = 5^2)\), create a random variable \(Y = \beta_0 + \beta_1 X + \epsilon\) where X refers to the first 100 values you created. You should have 100 X and Y value pairs at the end.
Q7
Please store your initial X and Y values in a CSV file called xy.csv with headers corresponding to x and y and upload these to CourseWorks.
Q8
Please fit the SLR then report your fitted parameters for the intercept and slope.
Q9
Please report the \(r^2\) value from your fit rounding to 6 decimals, i.e. if the value is 0.02700447, please report 0.027004.
In machine learning, there is a trend of looking at the \(r^2\) value between the Y values and the fitted values from their machine learning models. We will explore the behavior of looking at various \(r^2\) values between Y and various models below.
Q10
Please fit a second SLR between your data, Y, and the fitted values from Q8. Report the \(r^2\) value.
Q11
Let’s create another model, named foo, by calculating the line that uses your fitted slope from Q8 but with a different intercept. This intercept should be your fitted intercept from Q8 plus 2. Now let’s fit a third SLR between the fitted values from foo and the data Y. Please report the r^2 value from this SLR.
Q12
Compare the \(r^2\) values between Q10 and Q11, and write at most 2 sentences on why.
Q13
Assuming we only add bias to the intercept term, beyond what values of bias would it be better to just fit the mean? Let’s assume the metric of interest is the sum of squared error.